Home: the Cockpit
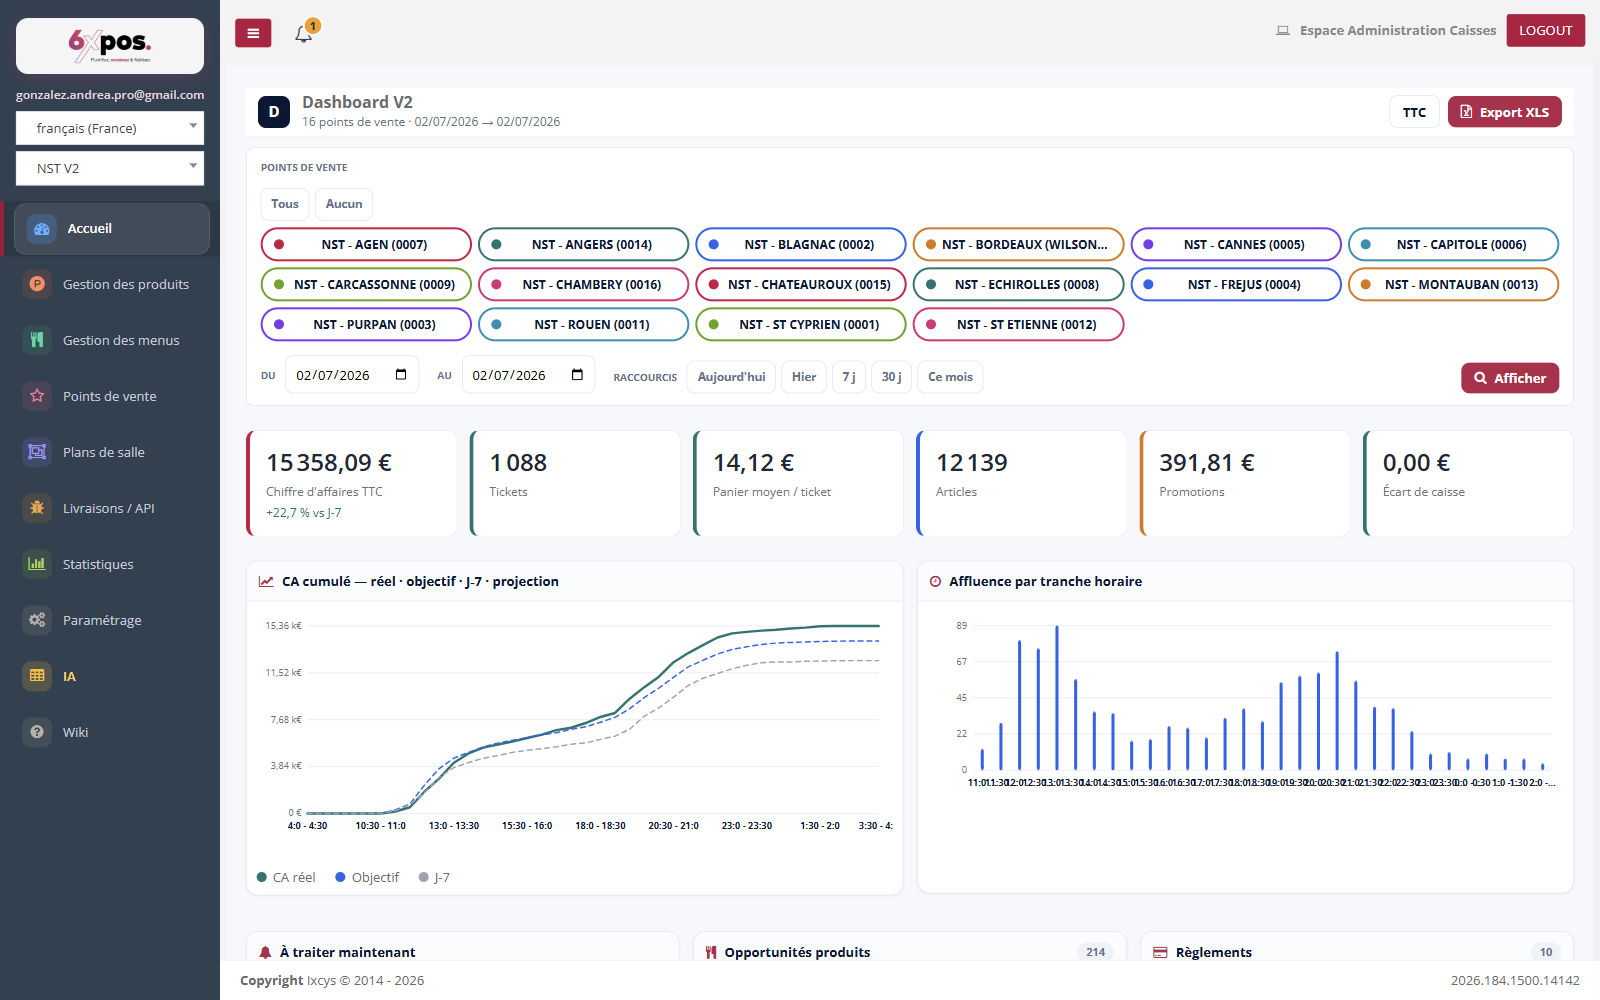
Figure 1 — The Cockpit: the 6 cards of the day, cumulative revenue against the target, footfall and the action blocks.
- The 6 cards: Revenue (excl./incl. tax toggle) with % delta vs D-7, Tickets, Average basket/ticket, End-of-day projection, Promotions, Cash discrepancy (red if non-zero).
- Cumulative revenue: four curves — Actual, Target (average of the same weekday over the last 4 weeks), D-7, and Projection (current day).
- Footfall: customers by time slot — to align teams with the peaks.
- To handle now: cash discrepancy, platform orders refused/not injected, tickets over 30 minutes in the kitchen, discounts for the period — otherwise "Nothing to report".
Good to know — the projection only appears for the current day, with at least 4 weeks of history and a minimum of activity — never in multi-day view. If the card is missing, that is normal.